“Quasi-Momentum” Strategies via Signal Processing (Part 1)
- Aidan Lee-Wen
- May 2, 2023
- 6 min read

I. Introduction
II. Methodology
III. Results
IV. Conclusion
Sam Layton and I have been working on experimenting with some signal processing methods. Nothing that hasn't been done before from a broad perspective, but we're trying to apply them in ways that are a bit unique, make sense, and avoid look-ahead bias. This study outlines the first attempt of a few ideas.
While the primary backtested portfolios fail to show much of a difference from the benchmark, this is not a surprise considering the nature of the tests outlined in this Part 1. However, we find significant improvement in the spread portfolios.
I. Introduction
It is commonly known in the field of quantitative research that rolling calculations can contain sudden spikes and drops as volatility, or other anomalies, enter and leave the rolling window of observation. As a result, alternative practices have been developed for transforming data in an attempt to smooth large-magnitude anomalies; these practices can also aid the research process in reducing the risk of overfitting. For example, methods for calculating realized volatility attempt to alleviate this issue by giving more weight to recent returns (exponentially weighted measures) and/or attempting to model the mean-reverting and regime-changing nature of volatility (GARCH models). The purpose of this study will explore an alternative method for transforming price data using a method of signal processing: The Fourier Transform (FFT). This study will explore the application of the FFT in transforming equity price data for traditional momentum portfolio creation.
The implementation of the FFT on equity price data creates a “continuous analog” on prices that mirrors natural, long-term movements. It is hypothesized that the filtered signal generated by the FFT will identify the driving movements found in traditional momentum strategies, free of short-term idiosyncratic price fluctuations. It is hypothesized that finding and trading on the underlying movements within momentum could filter out, to some degree, these short-term price fluctuations that lead to momentum crashes and larger swings, hence discounting volatility and overall risk. Furthermore, the degree to which a particular equity follows its FFT-filtered “continuous analog,” the less volatility that particular equity exhibits, as the analog is free from volatile, short-term price fluctuations. Hence, equities presenting strong momentum characteristics, while maintaining tight proximity to its continuous analog, could potentially exhibit less volatility with similar returns to the traditional momentum strategy.
The result illustrates that traditional factors, including 𝛽, high-minus-low (book value), and small-minus-big (size) continue to explain the backtested excess returns equally as well as the benchmark. Performance returns also remain relatively unchanged between the benchmark and backtested portfolios when applying these quasi-momentum strategies. However, significant improvements can be found within the backtested spread portfolios, where drawdowns can be potentially decreased. The backtested spread portfolios resulted in increased Sharpe Ratios due to their significant reduction in volatility compared to the benchmark counterpart, reducing overall variance drag.
The data for this study is provided by CRSP and includes monthly observations for all US equities on NYSE, AMEX, and Nasdaq exchanges. The backtest will run from 1962-08-01 to 2022-09-01 after completing all rolling calculations. Factor data was taken from Ken French’s website and implemented for testing the 3-factor model.
II. Methodology
The Fourier Transform has been traditionally used in fields related to signal processing. This algorithm uses mathematical projections to extract frequency information from time series data. In finance, the Fast Fourier Transform (FFT) is a value algorithm that allows for the efficient computation of the Fourier Transform of a large data set. In particular, the FFT is frequently applied to equity returns to extract the underlying frequency components of the price series. The less informative high-frequency idiosyncratic error can be discarded, leaving the underlying trends behind price movement.
Two “Quasi-Momentum Strategies” are implemented by adapting signal processing to equity prices via FFT. Performance and characteristics of these strategies will be compared to the benchmark of a traditional momentum strategy.
1. Benchmark Momentum
The benchmark momentum methodology involves the summation of log-adjusted returns of the last t-12 to t-2 periods (traditionally, months) in dividing equities into five equal-weight portfolios based on quintiles of these summations. Momentum assumes that strong past performance is indicative of relatively strong future performance and aims to capture the trend of positive returns according to this standard summation of log-adjusted returns.
2. Rolling FFT Momentum
To extract the general trends of momentum, free of high-frequency idiosyncratic error, the most frequent 13 sample periods (months) for each time period t are considered. The 3 lowest signal frequencies are included and the Inverse Fast Fourier Transform (IFFT) is taken to reconstruct a continuous analog of the original signal. An example of the reconstructed signal compared to the original price is provided in Figure 1. After the FFT is applied to the previous 13 months, returns are calculated from the “cleaned” equity price data for the last t-12 to t-2 months. Five equal-weight portfolios are then created based on quintiles of the summation log-adjusted returns according to standard, traditional momentum portfolio creation.

3. Continuity-Adjusted Momentum
This strategy is identical to the Rolling FFT Momentum from the previous section, with a subtle addition to the momentum calculation. Given the hypothesis of continuity’s effect on momentum’s volatility, equities that behave in a more continuous, consistent manner are prioritized. Hypothetically, the FFT can serve as a model in which errors between the real price and the “cleaned” price can be calculated. Discontinuity scores for each equity can then be calculated and used to weight their corresponding momentum values. Discontinuity scores are generated by taking the mean squared error between the real equity prices and the cleaned FFT prices (See Figure 2). The purpose of squaring the error weighs volatile, instantaneous changes in price harshly, leading to a large penalty in discontinuity. This is equivalent to taking the 2-norm of the difference between actual price and FFT cleaned prices. Dividing momentum by the discontinuity score (the mean-squared error) penalizes discontinuous momentum proportionally. Equities that have experienced less variation in the trend of their returns historically are identified through the goal of removing large mean-reversion-like swings in price. Once again, five equal-weight portfolios are then created based on quantiles of the t-12 to t-2 average discontinuity score according to standard, traditional momentum portfolio creation.

The benchmark portfolios will be compared with portfolios of the two backtested methodologies. A spread portfolio will also be included.
III. Results
As shown in the tables below, the benchmark, Rolling FFT backtest, and Continuity-Adjusted backtest all report very similar Sharpe Ratios, inconsistently better or worse:

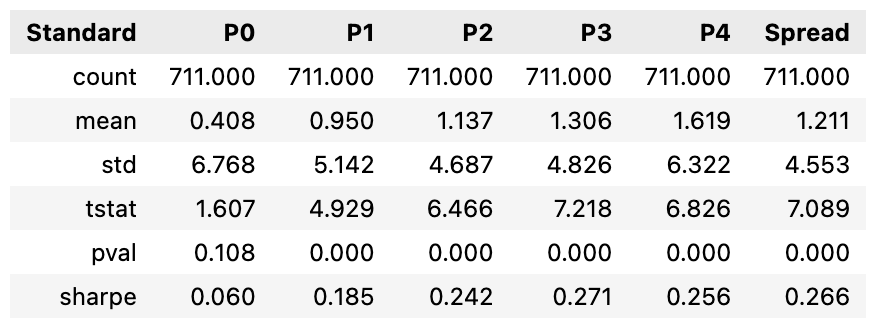

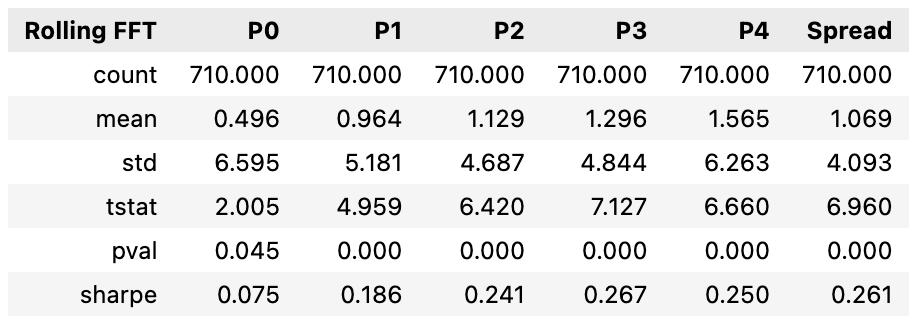

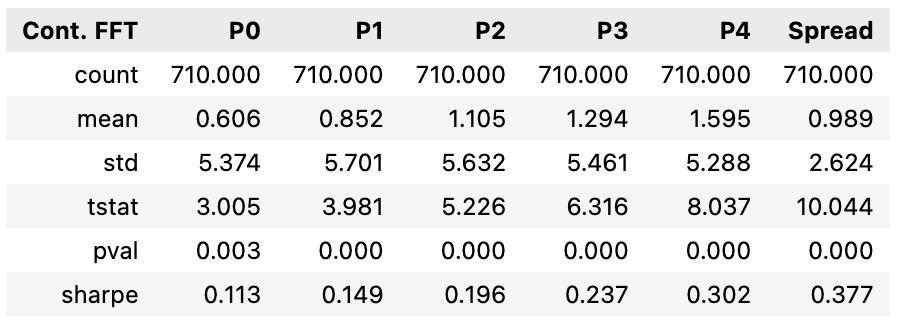
While the Continuity-Adjusted Momentum portfolios resulted in smaller mean returns than the benchmark portfolios, portfolio volatility remains lower and consistent across all quantiles. It is also noteworthy that the volatility of the backtest spread portfolios is lower than those of the benchmark; an improvement in Sharpe Ratios can be observed.
When fitting the monthly real returns of the backtest portfolios to the CAPM, it is evident that the backtest portfolios fit the CAPM relatively equal to the backtest portfolios:

When fitting monthly real returns of the backtest portfolios to the Fama-French 3-Factor model, it is also evident that the same traditional factors, including 𝛽, high-minus-low (book value), and small-minus-big (size), explain excess returns relatively equally:

The significant differences between the benchmark and backtests are potentially found within the spread portfolios. Yearly returns for the spread portfolios are provided below to illustrate the historical differences in realized drawdowns (see Figure 3):

Because there are few negative drawdown periods for the spread portfolios in history, it is difficult to assess and conclude their ability to consistently reduce drawdowns. However, the low in-sample volatility and Sharpe Ratio values suggest that the backtest spread portfolios, especially the Continuity-Adjusted Momentum spread portfolio, can significantly reduce realized volatility and therefore variance drag. Further evidence of this is portrayed when calculating 1-year realized volatility for the spread portfolios:

IV. Conclusion
This study proposes two potential methods for price data transformation for creating momentum portfolios. Two backtested methods, Rolling FFT Momentum and Continuity Adjusted Momentum, are compared against a standard benchmark. Results reveal that performance in terms of Sharpe Ratio remains relatively unchanged across all portfolios. Traditional factors, including 𝛽, high-minus-low (book value), and small-minus-big (size) continue to explain excess returns equally as well as the benchmark. Significant differences are found in the performance of the spread portfolios, where the backtest spread portfolios, especially for Continuity-Adjusted Momentum, may have the ability to reduce drawdowns and therefore variance drag.
Other methods to measure the applicability of the FFT to equity prices and momentum portfolio creation should be tested. This study is limited in its ability to transform prices due to the small t-12 to t-2 window on monthly timeframes. Shorter timeframes where randomness and volatility are more present, such as with weekly, daily, or even intraday price data need to be tested. It is recommended that testing on value-weight portfolios also be conducted. An additional testing framework to be tested is using the FFT in a rolling manner, but keeping the back-period constant at the inception of the asset. This framework will apply the FFT to the entire time series, but roll forward as new data is added to avoid look-ahead bias.


Comments