Mean Reversion Distance Study
- Aidan Lee-Wen
- Aug 31, 2021
- 7 min read
Updated: Sep 1, 2022
*03/09/2022 UPDATE: Added VIX Reversion Short, remade plots to remove duplicate datapoints
I. Introduction & Overview
II. Results: S&P 500 Futures
III. Results: Commodities
IV. Results: Currencies (FOREX)
V. Results: Bonds
VI. Results: Equities
VII. Results: VIX
VIII. Summary & Conclusion
I. Introduction & Overview
This study will explore how returns for trading mean reversion change as price deviates farther and farther from the mean. Take a look at the two examples below:


Does buying the larger distance from the mean have a higher probability of mean reverting compared to the smaller distance? How do probabilities and mean returns change as distance changes? Are results different when buying the dip versus shorting a rally?
This study will answer these questions for trading both long and short across a variety of asset classes on a daily timeframe:
- S&P 500 Futures: E-mini S&P 500 (/ES)
- Commodities: WTI Crude Oil Futures (/CL)
- Currencies (FOREX): EUR/USD Pair
- Bonds: iShares Core U.S. Aggregate Bond ETF (AGG)
- Equities: SPDR S&P 500 ETF Trust (SPY), Apple (AAPL), and AT&T (T)
- The CBOE Volatility Index (VIX)
To calculate deviation from the mean, this study will use a 20 Exponential Moving Average (EMA) and measure price distance as the number of Average True Ranges (ATRs) away from the 20 EMA; this is called a Keltner Channel (see the post Keltner Channel Study: Mean Reversion for more information). ATR measures the average dollar amount a security has moved within the last x-periods. Below is an example of a Keltner Channel with a 2.25 ATR multiplier:

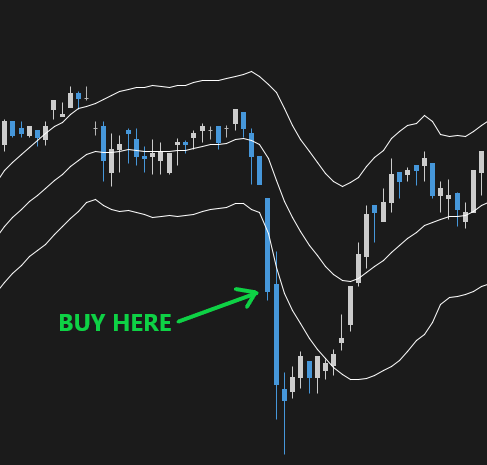
The purpose of creating upper and lower bands is to create volatility adjusted signals for potential mean reversion trade opportunities. The trade conditions include buying any close below the lower Keltner Band and shorting any close above the upper Keltner Band, as shown below:

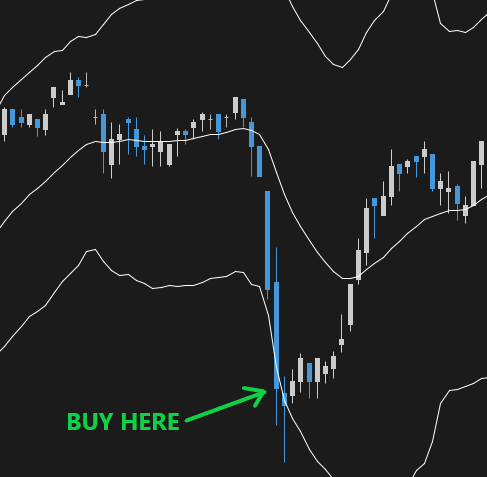
The distance of the upper and lower bands will begin at 2.25 ATRs away from the 20 EMA (as shown to be meaningful in Keltner Channel Study: Mean Reversion), then increase by 0.05 increments, thereby widening the bands. This will require larger and larger deviations from the mean in order for the trade conditions to be met. If increasing the increment by 0.05 fails to include new data points, the duplicate will not be included to improve readability. Below is an example of how a wider band affects the entry point of a mean reversion trade:


The results for holding for 1, 2, 3, 4, and 5 days will then be recorded. If a trade was taken, price must cross back into the band in order for another trade to be taken. This is to help prevent trading the same price swing repeatedly.
Scatterplots of the results for both long and short trades will be reported to reveal observations for each asset class. Areas on the right on the scatterplots are shaded orange to highlight where sample size < 10 and in red to highlight where sample size < 5. The results for low sample size observations should not be relied upon and were only included to provide readers with the complete, raw results.
II. Results: S&P 500 Futures
When buying large downside deviations for mean reversion on E-mini S&P 500 Futures (/ES), there is a clear uptrend in mean returns as distance from the mean increases. This gives merit to the "buy the dip" mentality on S&P Futures; the bigger the dip, the better. The results for trading long mean reversion on E-mini S&P 500 Futures have the highest mean returns out of the other asset class tested in this study.

When shorting large upside deviations, variance between the results across the number of days held increases but generally remain positive overall. Larger upside deviations could indicate higher potential for mean returns, but once again, with increased variance across the number of days held. There are no clear patterns in the number of days held as distance from the mean increases, however the 1st day held generally lags in performance compared to the rest.

III. Results: Commodities
When buying large downside deviations for mean reversion on WTI Crude Oil Futures (/CL), there is a clear exponential downtrend in returns as distance from the mean increases. This heavily suggests that buying the dip does not work on oil futures, but that overall returns actually decrease drastically as distance from the mean increases. In other words, it may serve as a better momentum indicator. This may be because of the underlying fundamental reasons for such a large, drastic move in oil.

When shorting large upside deviations, mean returns increase quite strongly. The results for trading short mean reversion on WTI Crude Oil Futures are the strongest and clearest out of the other asset class tested in this study.

IV. Results: Currencies (FOREX)
When buying large downside deviations for mean reversion on the EUR/USD currency pair, there is no clear trend in returns. The overall results are negative and remain fairly random as distance from the mean increases. This is likely due to the absence of mean reversion in currency pairs.

When shorting large upside deviations, returns begin and remain negative, but turn positive and follow a strong uptrend when price deviated about 3.25 ATRs away from the 20 EMA. This is reveals that a strong mean reversion presence may appear when such an extreme upside deviation occurs. However, returns remain consistently negative for deviations below about 3.25 ATRs.

V. Results: Bonds
When buying large downside deviations for mean reversion on the iShares Core U.S. Aggregate Bond ETF (AGG), mean returns begin positive and trend upwards clearly and strongly as deviation distance increases. Results for holding for 5 days are consistently higher than holding for 1 day, suggesting that the "buy the dip" strategy works quite well in bonds; the bigger, the better. The results for trading long mean reversion on the iShares Core U.S. Aggregate Bond ETF have the least amount of variance across the number of days held out of the other asset class tested in this study. The returns reported below do not include coupons, but only price returns.

When shorting large upside deviations, overall mean returns remain flat, close to zero but slightly positive, and variance increases as deviation from the mean grows larger. Results for holding for 1 and 2 days are consistently positive, suggesting that one or two day reversions may occur to stabilize growth levels, but it may be difficult to create a short mean reversion strategy around bounds using this method.

It should be noted than within the "bonds" category, there are a variety of asset classes. Municipal bonds, treasuries, corporate bonds, etc. will behave much differently from each other. Other variables such as maturity length, duration, and yield-vs-credit-rating will also affect behavior. It should be noted that a strategy that works on high yield corporate bonds may perform very differently on 20-yr treasuries.
VI. Results: Equities
Evaluating mean reversion in equities is not so simple. For the results on the SPDR S&P 500 ETF Trust (SPY), the change in mean returns is quite random. There are slight uptrends and overall positive results, but with the drastic increases in variance across the number of days held make it difficult to make conclusions with confidence:


When asking the question: "does trading mean reversion in this manner work on equities, long or short?" the answer is simply: it depends. There are many variables that contribute to an equity's behavior and therefore different strategies vary across different equities. Market cap, EPS & P/E, and sector are just a few variables that vary across different equities. Does a company practice share buybacks or give dividends? Differences in fundamental business practices make it difficult to obtain consistent results across all equities.
Below is Keltner Fade Short test performed on two equities that are both included in the S&P 500 Index: Apple (AAPL) and AT&T (T) (see the post Keltner Channel Study: Mean Reversion; a 'Fade Short' test is simply shorting any close above the upper Keltner Band 2.25 ATRs from the 20 EMA). Both equities perform very differently when trading short mean reversion in this manner:


Shorting the overextension on AT&T (T) produces positive mean returns that improve as the number of days held increases, while performance on Apple (AAPL) worsens. AT&T (T) is seen as a more defensive stock with less volatility and a high dividend yield; investors are not looking to profit from drastic price increases (although things may change with the drama behind the Discover (DFS) merger). On the other hand, Apple (AAPL) is growth stock where investors are looking for drastic price increases. The company practices share buybacks and investors are willing to pay a higher price per dollar of earnings. As a result, shorting Apple (AAPL) in the name of mean reversion does not produce favorable results.
What is the defining variable for an equity that is suitable for mean reversion distance trading. is it P/E, sector, or market cap? More testing is required to identify any common denominators, but it should not be assumed that one strategy fits all.
VII. Results: VIX
When shorting large upside deviations for mean reversion on the CBOE Volatility Index (VIX), mean returns remain positive but do not increase with deviation magnitude.

With all reported mean returns being positive, it is clear that (implied) volatility exhibits mean reversion tendencies as well. As distance from the mean increases, mean returns are inversely parabolic. This can make sense intuitively: if (implied) volatility is extreme, there is a high demand for hedging equity portfolios. This is likely driven by fundamental, global, economic events that cause worry and fear for the future. The demand for hedging could continue to increase with such events. However, because the VIX is simply a weighted average of all SPX implied volatilities, this data should not be over-analyzed beyond the fact that implied volatility does exhibit mean reversion tendencies.
Long-side mean reversion for the VIX will not be reported due to a lack of sufficient sample size.
VIII. Summary & Conclusion
The key takeaways for each asset class are:
- S&P 500 Futures: Buying the dip works - generally, the bigger, the better - but with higher variance than some other asset classes. Shorting the overextension can generally work but is met with increasing variance.
- Commodities (Oil): Buying the dip does not work at all, but results worsen exponentially. Shorting the overextension works very well with a clear increase in mean returns.
- Currencies (FOREX): Mean reversion in this manner does not produce favorable returns, but there is a point where short-side mean reversion can appear in extreme circumstances.
- Bonds: Buying the dip works very well as shown by a clear and tight uptrend in results. Shorting is barely positive with a flat trend and only increasing variance.
- Equities: It depends on the stock. Equities can behave very differently from each other, even if they are in the same index or sector.
- VIX: Short the overextension works and produces positive expected returns. Mean returns are inversely parabolic.
Note that this study only analyzed results on a daily timeframe. Results on shorter, intra-day timeframes may be different.