MACD Study (Part 1): EMA vs SMA
- Aidan Lee-Wen
- Jan 4, 2021
- 3 min read

Updated: Jan 18, 2022
*01/18/2022 UPDATE: The study MACD Study (Part 2): Period Settings has been deprecated. An overhaul and re-post is pending
I. Introduction & Overview
II. Test Conditions
III. Results - Any Crossing
IV. Results - Below Zero Line
V. Analysis & Conclusions
I. Introduction & Overview
Out of all of the retail indicators I have come across over the years, the Moving Average Convergence Divergence (MACD) is the only lower-chart indicator that I still use today. I believe that all traders should fully understand the tools that they use: it's objective, how it's calculated, and how it would appropriately apply to analysis. The purpose of this multi-part MACD study is to validate (or invalidate) its usage and compare results over a variety of different settings, asset classes, and symbols.
To introduce the MACD, it is a popular indicator used to help measure trend-following and momentum. It consists of two lines: the MACD Line and the Signal Line. The MACD Line is calculated by a faster moving average (default: 12) minus a slower moving average (default: 26). The Signal Line is calculated by taking a moving average (default: 9) of the MACD Line. A Histogram is then added to help visualize the difference between the MACD Line and the Signal Line. By default, these moving averages are Exponential Moving Averages (EMA). A clearer visual of the calculation is shown below:


This first part of the MACD study series will backtest the variability of outcomes and compare the usage of an EMA vs a Simple Moving Average (SMA) over both daily and weekly timeframes of the SPDR S&P 500 ETF Trust (SPY). For now, the default periods of [12, 26, 9] will be used; different period settings will be tested in future parts of this MACD study series. The test will start from 01/01/2003 and will compare two different buying conditions: Any Crossing and Below Zero Line. Only long positions will be tested and will use closing prices to ensure the crossing event. All backtested trades' Profit/Loss Percentage (P/L %) summary statistics will then be analyzed and compared.
II. Test Conditions
Test Condition 1: Any Crossing
The buy-to-open condition for this trade is when the MACD Line crosses above the Signal Line, no matter where the crossing occurs. The sell-to-close condition will then be met the next time the lines cross.

Test Condition 2: Below Zero Line
The buy-to-open condition for this trade is when the MACD Line crosses above the Signal Line while both are below the zero line (pink middle line). The sell-to-close condition will then be met the next time the lines cross.

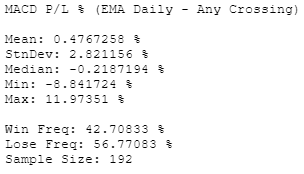
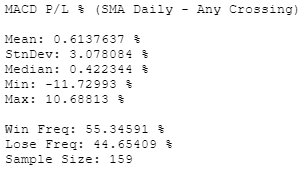
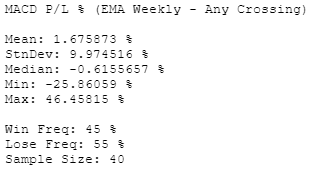
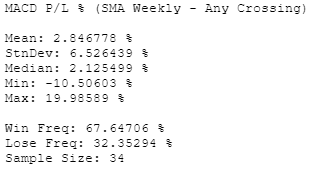
III. Results - Any Crossing
EMA Daily:


SMA Daily:


EMA Weekly:


SMA Weekly:


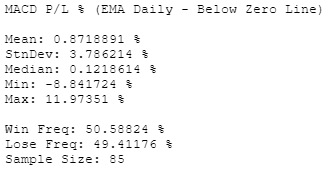
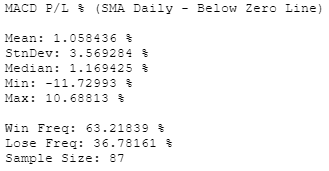
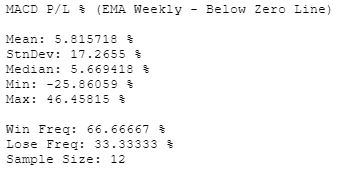
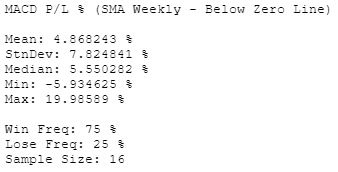
IV. Results - Below Zero Line
EMA Daily:


SMA Daily:


EMA Weekly:


SMA Weekly:


V. Analysis & Conclusions
Keep in mind that weekly timeframe trades for the Below Zero Line test were not able to take enough trades to able to be garner a large sample size. The following observations have been made:
- All trades with SMA settings have higher win frequencies than the EMA settings
- All trades with SMA settings have win frequencies above 55% (55.34% being the lowest)
- All trades with SMA settings have higher overall mean returns and medians than the EMA settings (except for the weekly Below Zero Line trades)
- All trades with SMA settings, except for the daily Any Crossing trades, have a lower standard deviation of returns than the EMA settings
- All trades with SMA settings have a tighter range between min and max returns than the EMA settings
- The Below Zero Line condition trades have significantly higher win frequencies and mean returns than the Any Crossing condition trades
- The Any Crossing condition was able to take approximately twice as many trades as the Below Zero Line condition on the daily timeframe, and about three times as many on the weekly timeframe
- All tests resulted in positive mean returns
The repeated use of the word "all" in the analysis shows great consistency in the results and allows a confident conclusion to be made. With higher win rates, mean returns, and lower variability, the SMA setting is the clear winner.
Although the Any Crossing condition was able to take two to three times as many trades as the Below Zero Line condition, the Below Zero Line trades performed significantly better; this suggests quality vs quantity. Therefore, buying when the MACD Line and Signal Line cross below the zero line could offer a higher probability of favorable results.
"All tests resulted in positive mean returns" and "all trades with SMA settings have win frequencies above 55% (55.34% being the lowest)". This is incredibly significant, as no actual price action or market structure were taken into account for these trades; buy and sell conditions were solely based on the MACD. With these results, the MACD has proven to be a viable indicator.
Stay tuned for further parts of this MACD study series. Future plans include testing different period settings, asset classes, and symbols.


Comments